The indoor environment, live.
Temperature, CO2, humidity, energy and air quality, from portfolio to scheme to block to dwelling to room. Not a monthly report. A live feed, updated continuously, with every number traceable to the sensor that produced it.
What in-use monitoring means.
01 / What it isA certified Passivhaus building has a design model that predicts its performance: a PHPP file with a calculated space-heating demand, a ventilation rate, an overheating hours figure. Those numbers describe a building that performs as specified, with the occupants and schedules assumed at design stage.
In-use monitoring replaces that prediction with a measurement. A network of LoRaWAN sensors, already in the building or added to it, reports continuously: indoor temperature and humidity in every room, CO2 as a proxy for ventilation adequacy, energy consumption at meter or circuit level, water consumption where sensors are fitted.
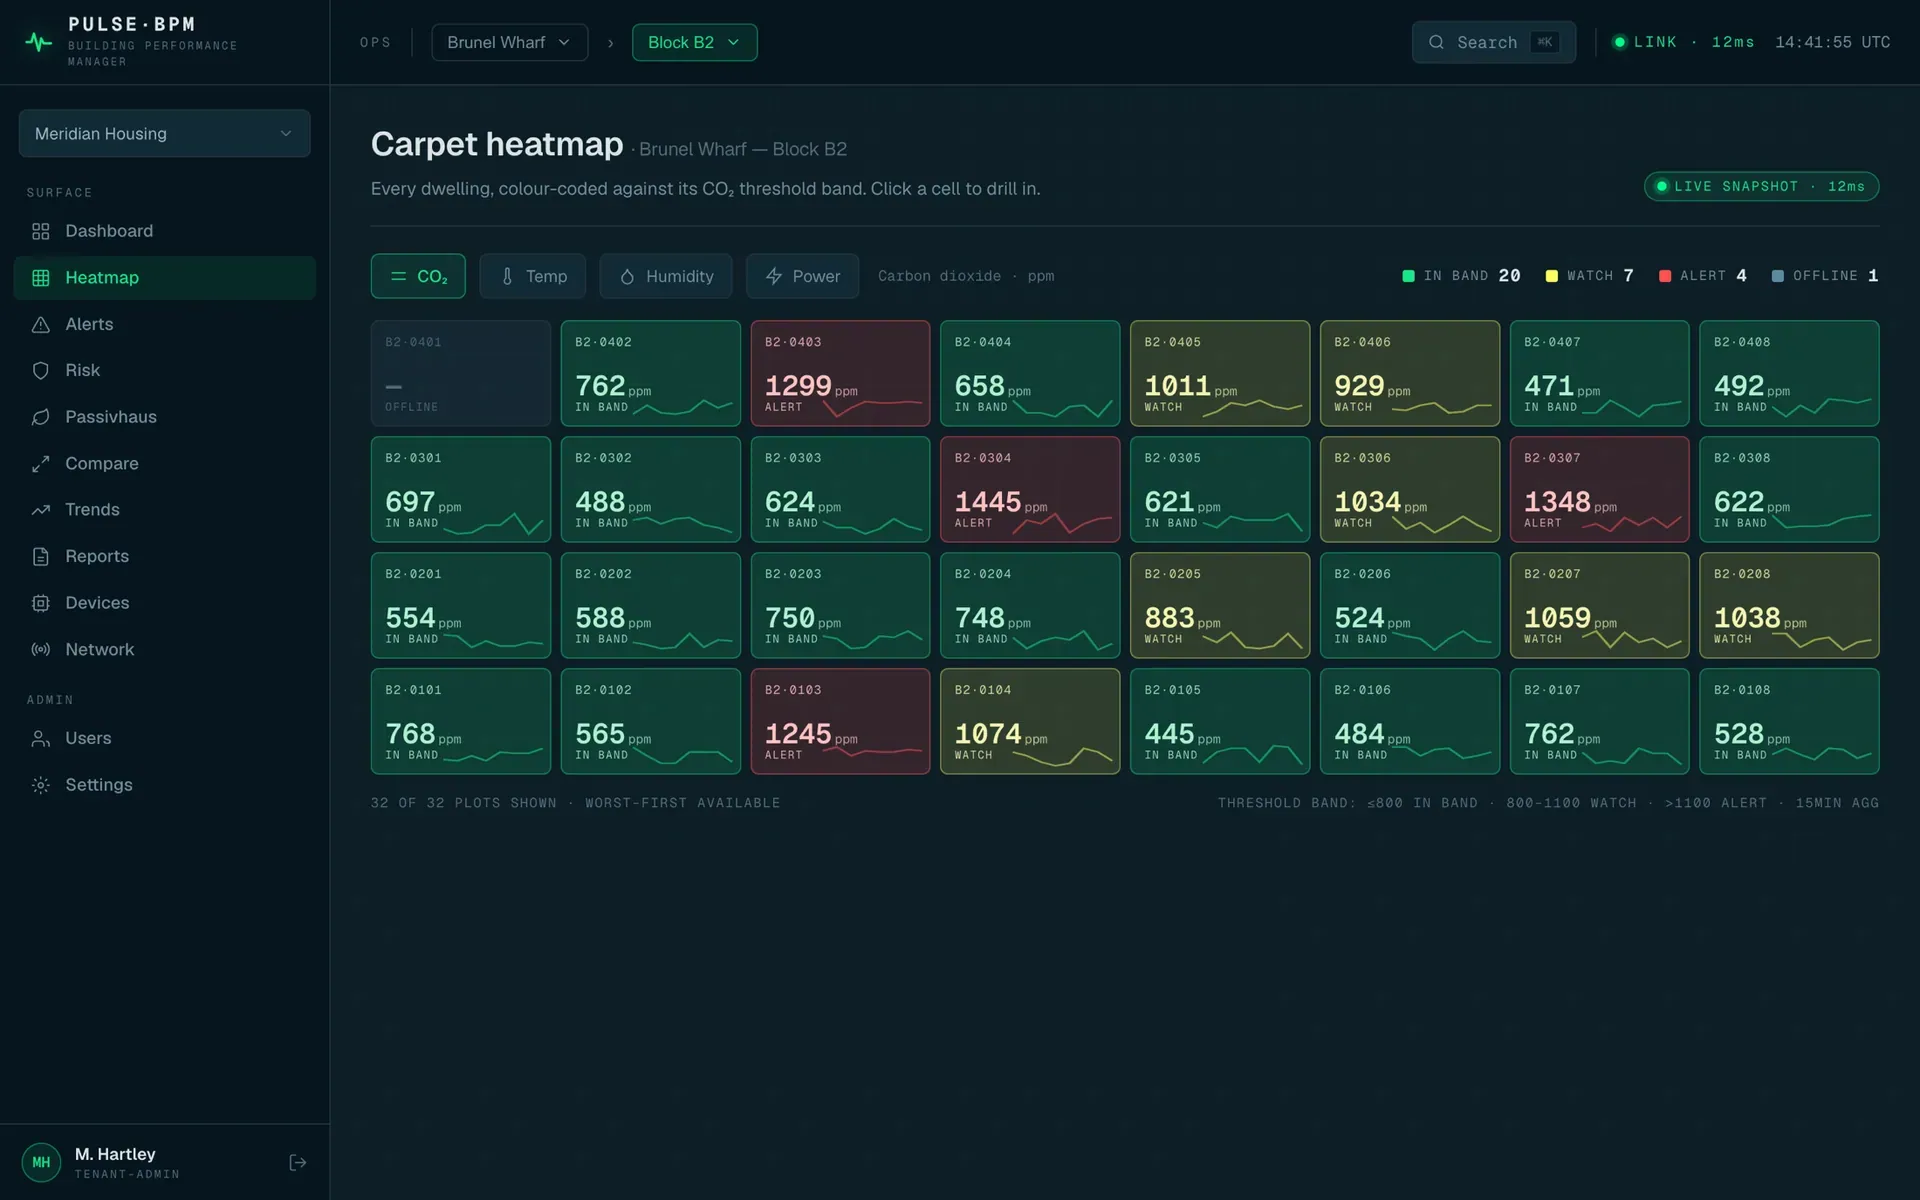
Pulse ingests that data, converts it once at write time with a known provenance chain, and presents it as a continuous picture of the building's actual indoor environment and energy use. The portfolio heatmap gives a single colour-coded view of every dwelling simultaneously. One click goes to the scheme, another to the block, a third to the dwelling, a fourth to the individual room whose CO2 is climbing.
Every reading carries its conversion path and a quality flag. Values are converted once, at write time, with no silent fallbacks and no read-time drift. If a sensor goes dark, Pulse flags the gap immediately on every surface that draws from it, and the device register shows the last-seen timestamp in red.
Pulse is LoRaWAN-first and sensor-agnostic. If it speaks LoRaWAN and reports a recognised parameter, it lands in the platform. No new cabling required. Existing sensor infrastructure, plus the gateway network, is enough to start monitoring.
What Pulse measures, and why each matters.
02 / MetricsOperative temperature per room, compared against the Passivhaus comfort band (20 to 25 degrees C in winter, free cooling target in summer). Overheating is detected automatically and reported as exceedance hours for TM52/TM59 compliance.
CO2 is the most reliable proxy for ventilation adequacy in an occupied building. Elevated CO2 in a certified Passivhaus dwelling, where MVHR should maintain 400 to 800 ppm, is a strong indicator of a commissioning fault, a blocked filter or a change in occupancy.
Humidity is the primary input to mould-risk scoring. Pulse calculates surface condensation risk continuously from air temperature and relative humidity, using a method consistent with BS EN ISO 13788. Dwellings approaching the mould-risk threshold are flagged in the risk register before damage occurs.
Electricity, heat and gas at meter or sub-meter level. Energy readings are aggregated through the hierarchy and compared against the design-stage PHPP target, producing a live view of the performance gap between the certificate and the reality.
Where pulse-output water meters are fitted, Pulse ingests consumption at scheme, block and dwelling level. Anomalous consumption, a running tap, a leak, an unexpectedly high reading in a vacant unit, is surfaced automatically.
Where sensors support it, Pulse ingests particulate matter (PM2.5, PM10) and VOC levels, extending the air quality picture beyond CO2. This is particularly relevant in retrofitted buildings where legacy materials or occupant activities may introduce pollutants that MVHR alone cannot eliminate.
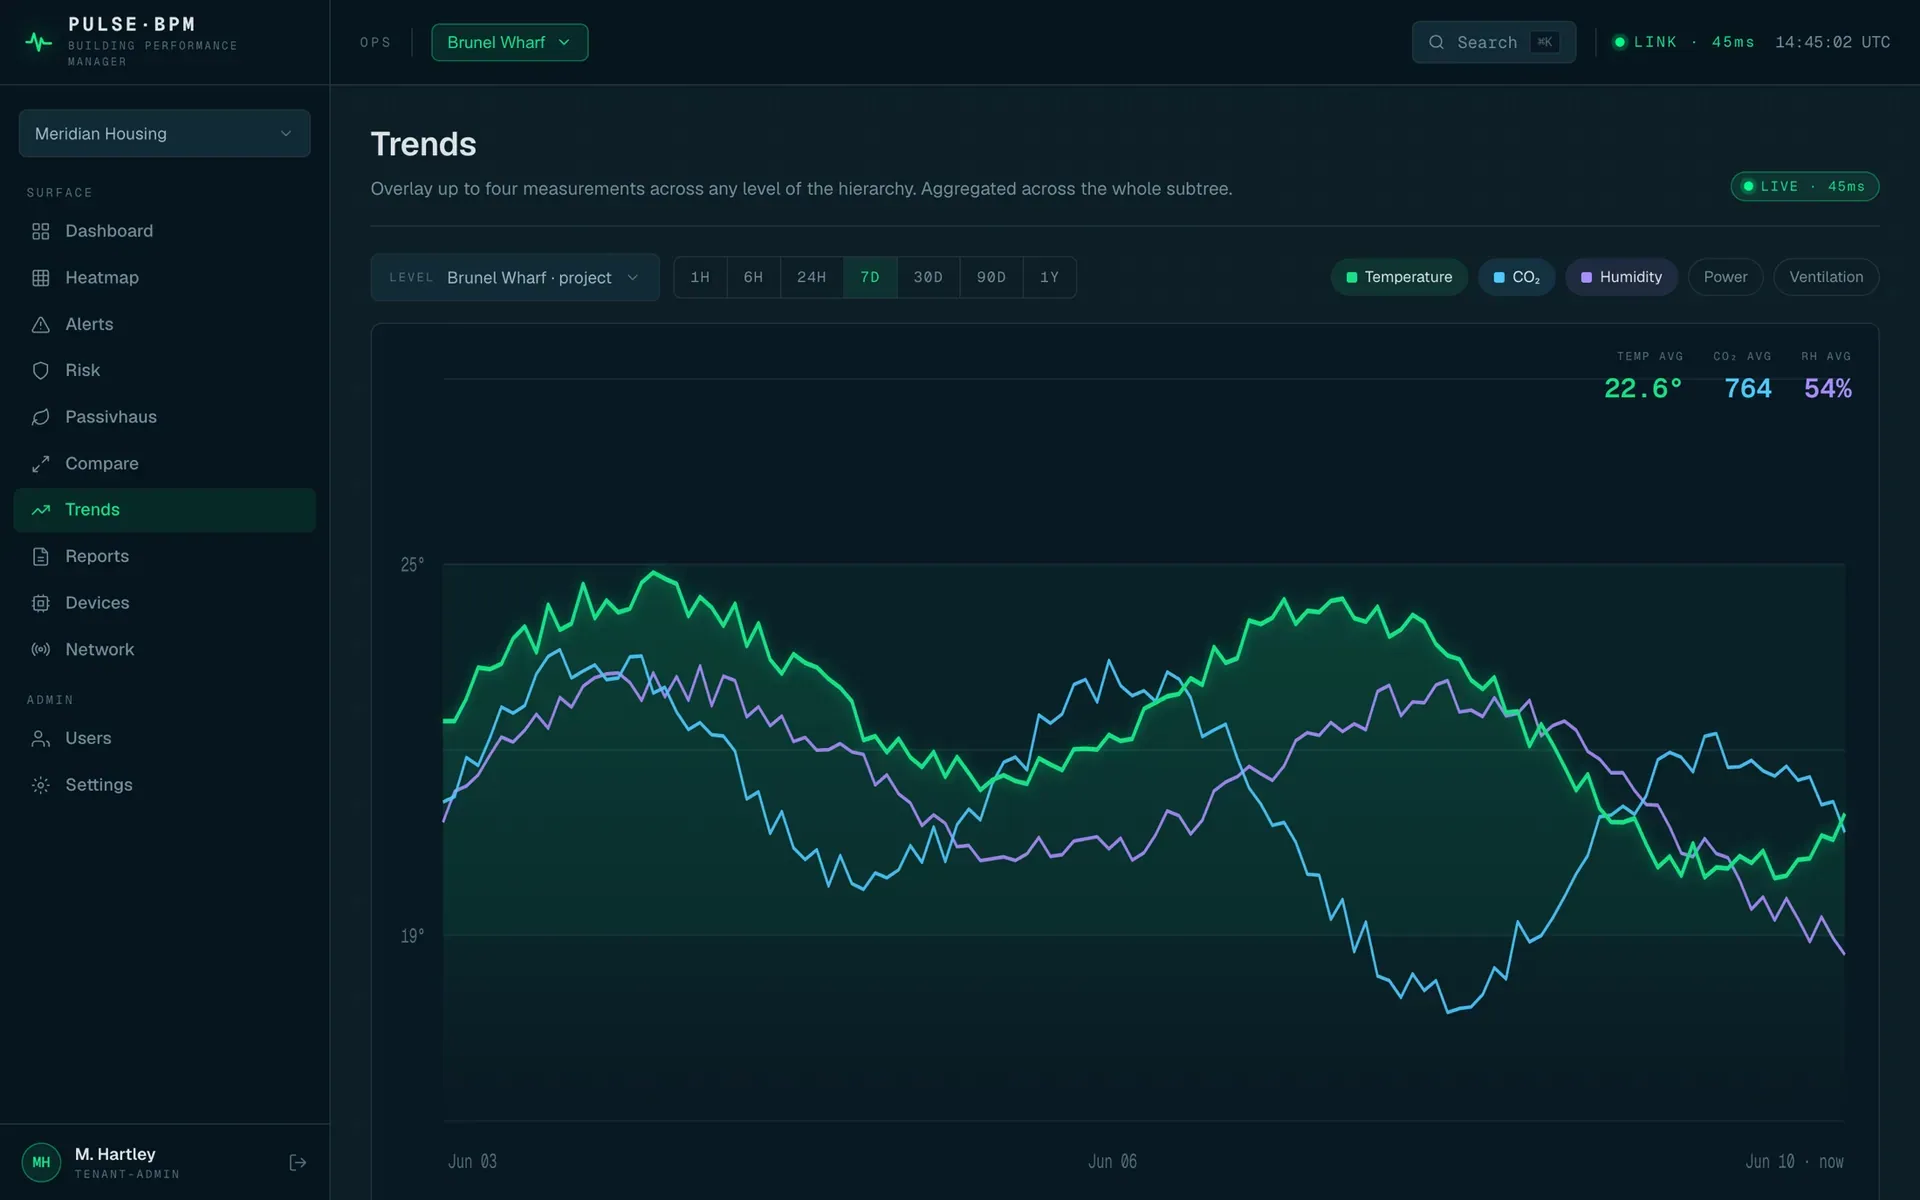
Overlay any metric, across any level of the hierarchy, over any period.
The window runs from the last hour to 180 days: temperature across every sensor in a scheme, CO2 in a single bedroom over a week, or energy consumption at block level this winter versus last. The trends view aggregates automatically as you move up and down the hierarchy, so the number you see is always the right number for the level you are viewing.
Common questions.
03 / FAQWhat metrics does Pulse monitor?
Pulse ingests temperature, relative humidity, CO2 concentration, energy consumption, water consumption, indoor air quality (including VOCs where sensors support it), and ventilation proxies. Any LoRaWAN sensor that reports these parameters can feed the platform. The hierarchy maps to portfolio, scheme, block, dwelling and room level, so every measurement is aggregated and drilled-down consistently.
How does Pulse handle sensor data quality?
Every reading in Pulse carries a known conversion path and a quality flag. Values are converted once, at write time. If a sensor goes offline, Pulse flags the gap immediately in the device register and on every view that draws from that sensor. There are no silent fallbacks, no read-time drift, and no interpolated values presented as real measurements.
Can Pulse monitor from a single dwelling to a large portfolio?
Yes. The platform is in use across multi-residential schemes with hundreds of dwellings and thousands of sensors. The same hierarchy that spans a whole portfolio also drills to a single room. A self-builder monitoring one home sees the same data quality and dashboard structure as a housing association monitoring a large estate.
What is the difference between a comfort metric and an energy metric in Pulse?
Comfort metrics capture the indoor environment as occupants experience it: temperature, humidity, CO2 and air quality. Energy metrics capture what the building is consuming: electricity, heat, gas or water. Both sit in the same hierarchy, so you can see, for example, that a dwelling with rising CO2 also shows elevated heating consumption, and investigate whether that is a ventilation fault or an occupancy change.
See a live portfolio.
A walkthrough of Pulse on a real monitored portfolio, from the heatmap to a single room's CO2. No slides, no mock data.